


Dear Aspirants, Our IBPS Guide team is providing new series of Quants Questions for IBPS Clerk Prelims so the aspirants can practice it on a daily basis. These questions are framed by our skilled experts after understanding your needs thoroughly. Aspirants can practice these new series questions daily to familiarize with the exact exam pattern and make your preparation effective.
Start Quiz
Directions (01-05): Study the following information carefully and answer the questions given below.
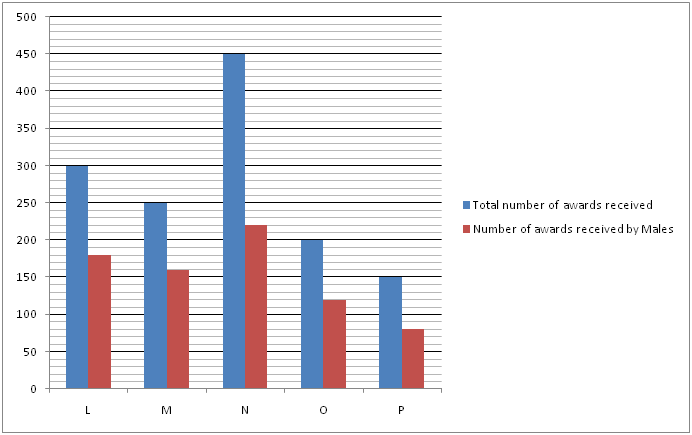
The given bar graph shows the total number of awards given by five different states namely L, M, N, O and P and also given the number of awards received by males in these five states.
1) The number of awards received by males in O is what percent more than the number of awards received by females in M?
A.28.92%
B.30.30%
C.33.33%
D.36.67%
E.39.91%
2) What is the ratio of the number of awards received by males in P and L together to the number of awards received by females in N and O together?
A.23:29
B.24:31
C.25:32
D.13:18
E.None of these
3) What is the average number of awards received by females in all the states together?
A.112
B.115
C.120
D.118
E.114
4) If the number of awards received by females in K is 40 less than the number of awards received by females in N and the number of awards received by males in K is 20% more than the number of awards received by males in P. Find the total number of awards received in K?
A.286
B.288
C.290
D.294
E.296
5) The number of awards received by males in L is what percent of the total number of awards received in O?
A.80%
B.90%
C.95%
D.85%
E.None of these
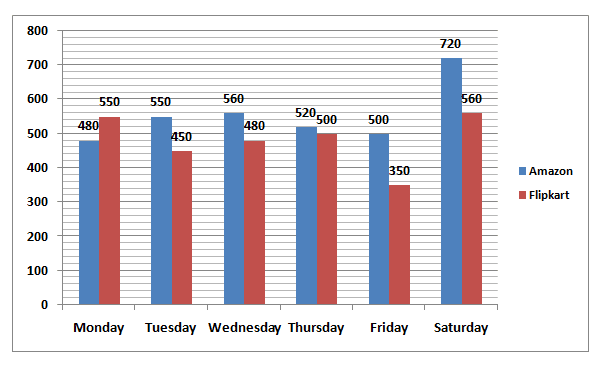
Directions (06-10): Study the following information carefully and answer the questions given below.
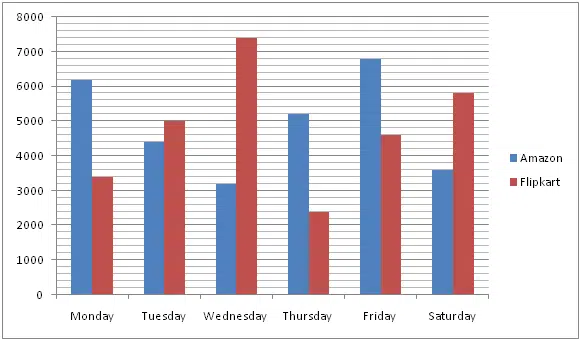
The given bar graph shows the number of wall paper stickers sold on two different platforms namely Amazon and Flipkart in six different days of a week from Monday to Saturday.
6) What is the average number of wall paper stickers sold on Amazon on Tuesday, Thursday and Saturday together?
A.4200
B.4300
C.4400
D.4500
E.4800
7) The total number of wall paper stickers sold on Flipkart and Amazon together on Monday is what percent of the total number of wall paper stickers sold on Flipkart and Amazon together on Wednesday?
A.90.56%
B.92.56%
C.88.56%
D.94.56%
E.86.56%
8) What is the ratio of the number of wall paper stickers sold on Amazon on Tuesday and Saturday together to the number of wall paper stickers sold on Flipkart on Monday and Friday together?
A.2:1
B.3:2
C.1:2
D.1:1
E.2:3
9) What is the difference between the total number of wall paper stickers sold on Flipkart on Tuesday and Friday together and the total number of wall paper stickers sold on Flipkart on Wednesday and Saturday together?
A.3200
B.3600
C.4000
D.4400
E.2800
10) If the respective ratio of the number of kitchen to bathroom wall paper stickers sold on Amazon on Thursday and Friday is 7:6 and 9:8 and only kitchen and bathroom wall paper stickers were sold on Amazon on Thursday and Friday, then how many bathroom stickers were sold on Amazon on Thursday and Friday together?
A.5200
B.5400
C.5000
D.4800
E.5600
Try Data Interpretation Questions Online Mock Test
Answers :
1) Answer: C
Number of awards received by females in M = 250 – 160 = 90
Required percentage = (120 – 90)/90 * 100 = 30/90 * 100 = 33.33%
2) Answer: E
Required ratio = (80 + 180):((450 – 220) + (200 – 120))
= 260:(230+80)
= 260:310
= 26:31
3) Answer: D
Number of awards received by females in L = 300 – 180 = 120
Number of awards received by females in M = 250 – 160 = 90
Number of awards received by females in N = 450 – 220 = 230
Number of awards received by females in O = 200 – 120 = 80
Number of awards received by females in P = 150 – 80 = 70
Required average = (120 + 90 + 230 + 80 + 70)/5
= 590/5
= 118
4) Answer: A
Female received awards in N = 450 – 220 = 230
Number of female received the awards in K = 230 – 40 = 190
Number of male received the awards in K = 80 * 120/100 = 96
Required total = 190 + 96 = 286
5) Answer: B
Required percentage = 180/200 * 100 = 90%
6) Answer: C
Required average = (4400 + 5200 + 3600)/3
= 13200/3
= 4400
7) Answer: A
Required percentage = (6200 + 3400)/(3200 + 7400) * 100
= (9600/10600) * 100
= 90.56%
8) Answer: D
Required ratio = (4400 + 3600):(3400 + 4600)
= 8000:8000
= 1:1
9) Answer: B
Required difference = (7400 + 5800) – (5000 + 4600) = 13200 – 9600= 3600
10) Answer: E
Number of bathroom wall paper sold on Thursday and Friday = 6/13 * 5200 + 8/17 * 6800
= 2400 + 3200
= 5600
Start Quiz
Directions (11-15): Study the following information carefully and answer the questions given below.
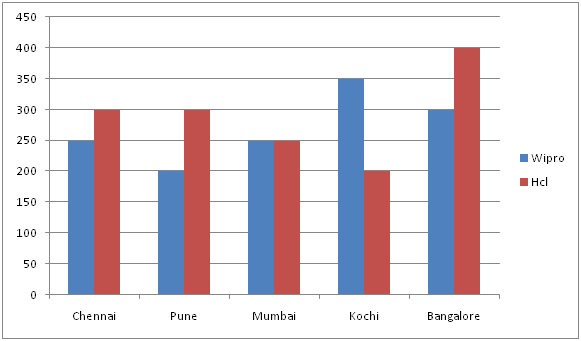
The given bar graph shows the number of employees working in Wipro and Hcl in five different cities namely Chennai, Pune, Mumbai, Kochi and Bangalore.
11) What was the ratio of the number of Wipro employees working in Pune to the number of Hcl employees working in Chennai?
A.2: 3
B.3: 2
C.1: 2
D.2: 1
E.None of these
12) Number of Wipro employees working in Mumbai and Bangalore together is approximately what percentage of total number of both Wipro and Hcl employees working in Mumbai and Bangalore together?
A.21%
B.32%
C.46%
D.58%
E.65%
13) Number of Hcl employees working in Kochi is what percentage less than the number of Hcl employees working in Bangalore?
A.30%
B.50%
C.70%
D.90%
E.None of these
14) In how many cities, the number of Wipro employees is more than 20% of the total number of Wipro employees?
A.1
B.2
C.3
D.4
E.None of these
15) Which of the following cities have Hcl employees less than 72% of Chennai’s Wipro employees?
A.4
B.3
C.2
D.1
E.0
Directions (16-20): Study the following information carefully and answer the questions given below.
The given bar graph shows the number of handkerchiefs sold by five different shops namely A, B, C, D and E in 2019.
16) What is the difference between the numbers of handkerchiefs sold by B and E?
A.25
B.30
C.35
D.40
E.45
17) If total number of handkerchief manufactured by A, B and D is 120, 180 and 110 respectively, then what is the average number of unsold handkerchief by A, B and D together?
A.30
B.35
C.40
D.45
E.50
18) The number of handkerchiefs sold by D is what percent of the number of handkerchief sold by C?
A.51.111%
B.52.222%
C.53.333%
D.54.444%
E.55.555%
19) If the selling price per handkerchief in E is Rs.5, then find the total revenue generated from selling all handkerchiefs by E?
A.Rs.450
B.Rs.480
C.Rs.500
D.Rs.550
E.Rs.600
20) If in each shop, the number of handkerchief sold in 2020 is 10% increased, then what is the average number of handkerchiefs sold by all the shops in 2020?
A.120.4
B.124.3
C.128.4
D.118.6
E.126.3
Try Data Interpretation Questions Online Mock Test
Answers :
11) Answer: A
No. of Wipro employees working in Pune = 200
No. of Hcl employees working in Chennai = 300
Required ratio = 200: 300 = 2: 3
12) Answer: C
No. of Wipro employees in Mumbai and Bangalore = 250 + 300 = 550
No. of all the employees in Mumbai and Bangalore = 250 + 250 + 300 + 400 = 1200
Required % = 550/1200 * 100
= 46%
13) Answer: B
No. of Hcl employees working in Kochi = 200
No. of Hcl employees working in Bangalore = 400
Required % = (400 – 200)/400 * 100 = 50%
14) Answer: B
No. of Wipro employees = 250 + 200 + 250 + 350 + 300 = 1350
20% of 1350 = 270
Wipro employees in Kochi and Bangalore are more than 270.
15) Answer: E
72% of Chennai’s Wipro employees = 72% * 250 = 180
No cities have Hcl employees less than 180.
16) Answer: A
Required difference= 135 – 110
= 25
17) Answer: B
Number of unsold handkerchief in A = 120 – 90 = 30
Number of unsold handkerchief in B = 180 – 135 = 45
Number of unsold handkerchief in D = 110 – 80 = 30
Required Average = (30 + 45 + 30)/3 = 105/3
= 35
18) Answer: C
Required percentage = 80/150 * 100
= 53.333%
19) Answer: D
Required revenue = 110 * 5 = Rs.550
20) Answer: B
A = 90 * 110/100 = 99
B = 135 * 110/100 = 148.5
C = 150 * 110/100 = 165
D = 80 * 110/100 = 88
E = 110 * 110/100 = 121
Required average = (99 + 148.5 + 165 + 88 + 121)/5 = 621.5/5
= 124.3
Start Quiz
Directions (21-30): Read the following information carefully and answer the questions.
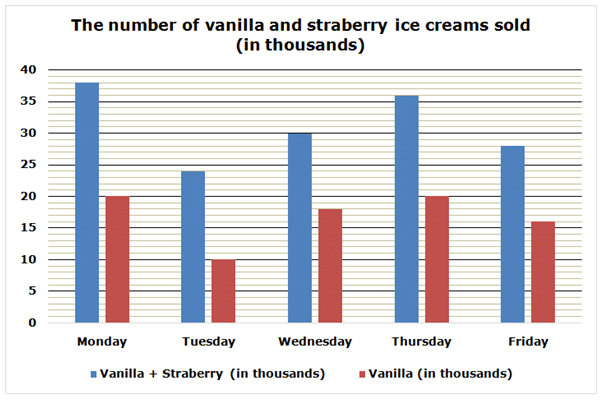
The given bar graph shows the number of two different ice creams i.e. vanilla and strawberry (in thousands)sold on five different days (Monday, Tuesday, Wednesday, Thursday and Friday) and also given the number of vanilla ice creams (in thousands) sold on these five days.
21) If the number of strawberry ice creams sold on Sunday is 12.5% more than that of Thursday and then find the number of strawberry ice creams sold on Sunday?
A.14000
B.12000
C.18000
D.16000
E.None of these
22) Find the ratio of the number of vanilla ice creams sold on Monday and Tuesday together and the number of strawberry ice creams sold on Monday?
A.5:3
B.2:1
C.4:7
D.9:8
E.None of these
23) The number of strawberry ice creams sold on Tuesday is how much percentage more/less than the number of vanilla ice creams sold on Thursday?
A.15% more
B.30% less
C.45% less
D.20% more
E.None of these
24) If the average number of chocolate and vanilla ice creams sold on Friday is 12500 and then the number of chocolate ice creams sold on Friday is what percentage of the number of strawberry ice creams sold on Friday?
A.50%
B.45%
C.60%
D.75%
E.None of these
25) Find the difference between the number of vanilla ice creams sold on Wednesday and the number of strawberry ice creams sold on Friday?
A.7000
B.9000
C.6000
D.3000
E.None of these
Directions (26-30): Read the following information carefully and answer the questions.
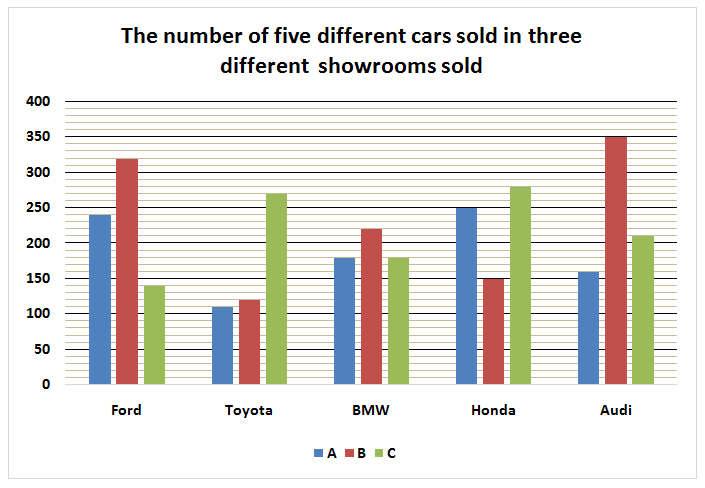
The given bar graph shows the number of five different cars i.e. Ford, Toyota, BMW, Honda and Audi sold in three different showrooms (A, B and C) in January.
26) In showroom A, the number of Mercedes-Benz cars sold is 9.09% more than that of Toyota and 25% of the Mercedes-Benz cars are unsold in showroom A and then find the number of Mercedes-Benz cars in showroom A?
A.100
B.180
C.120
D.160
E.None of these
27) Find the difference between the average number of Ford and BMW cars sold in showroom B and the average number of Audi cars sold in showrooms A, B and C?
A.30
B.10
C.50
D.70
E.None of these
28) The number of Honda cars sold in showroom B is what percentage of the number of Toyota cars sold in showrooms A, B and C?
A.40%
B.50%
C.10%
D.30%
E.None of these
29) If the number of Ford cars sold in showroom D is 14.28% more than that of showroom C and the ratio of the number of Ford and BMW cars sold in showroom D is 8:5 and then find the average number of Ford and BMW cars sold in showroom D?
A.110
B.130
C.150
D.170
E.None of these
20) Out of the total number of Ford cars sold in showrooms A, B and C, 60% of the Ford cars are sold for males and then find the total number of Ford cars sold for females in showrooms A, B and C together?
A.220
B.250
C.280
D.270
E.None of these
Try Data Interpretation Questions Online Mock Test
Answers :
21) Answer: C
The number of strawberry ice creams sold on Thursday=36000-20000=16000
The number of strawberry ice creams sold on Sunday=16000*9/8=18000
22) Answer: A
The number of vanilla ice creams sold on Monday and Tuesday (in thousands)=20+10 =30
The number of strawberry ice creams sold on Monday (in thousands)=38-20=18
Required ratio=30:18=5:3
23) Answer: B
The number of strawberry ice creams sold on Tuesday (in thousands)=24-10=14
Required percentage=(14-20)/20*100=-6/20*100=30% less
24) Answer: D
The number of chocolate and vanilla ice creams sold on Friday=12500*2=25000
The number of chocolate ice creams sold on Friday=25000-16000=9000
The number of strawberry ice creams sold on Friday=28000-16000=12000
Required percentage=9000/12000*100=75%
25) Answer: C
The number of strawberry ice cream sold on Friday=28000-16000=12000
Required difference=18000-12000=6000
26) Answer: D
The number of Mercedes-Benz cars sold in showroom A=110*12/11=120
The number of Mercedes-Benz cars in showroom A=120*4/3=160
27) Answer: A
The average number of Ford and BMW cars sold in showroom B=(320+220)/2=540/2 =270
The average number of Audi cars sold in showrooms A, B and C=(160+350+210)/3 =720/3=240
Required difference=270-240=30
28) Answer: D
The number of Toyota cars sold in showrooms A, B and C=110+120+270=500
Required percentage=150/500*100=30%
29) Answer: B
The number of Ford cars sold in showroom D=140*8/7=160
The number of BMW cars sold in showroom D=160/8*5=100
Required average=(160+100)/2=260/2=130
30) Answer: C
The number of Ford cars sold in showrooms A, B and C=240+320+140=700
The number of Ford cars sold in showrooms A, B and C=700*2/5=280
Start Quiz
Directions (31-35): Study the following information carefully and answer the questions given below.
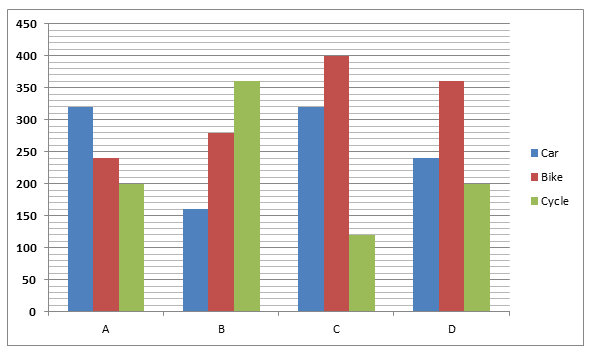
The given bar graph shows the number of car, bike and cycle in four different showrooms – A, B, C and D.
31) Number of cars and bikes in C is 80% of the number of cars in E and the number of Bikes and Cycles in B is 125% of the number of bikes in E. Find the difference between the number of cars and bikes in E?
A.378
B.384
C.388
D.392
E.396
32) Total number of bikes, cars and cycles in D is what percent of the total number of bikes, cars and cycles in C?
A.93.45%
B.95.23%
C.97.37%
D.99.45%
E.101.52%
33) Total number of cars, bikes and cycles in E is 20% more than the number of cars, bikes and cycles in B. Find the difference between the number of cars, bikes and cycles in E and A?
A.180
B.190
C.200
D.220
E.210
34) What is the ratio of the number of cars and bikes in D to the number of bikes and cycles in B?
A.15:16
B.4:5
C.12:13
D.5:6
E.None of these
35) Find the difference between the total number of cycles and cars in all the showrooms together?
A.120
B.130
C.140
D.150
E.160
Directions (36-40): Study the following information carefully and answer the questions given below.
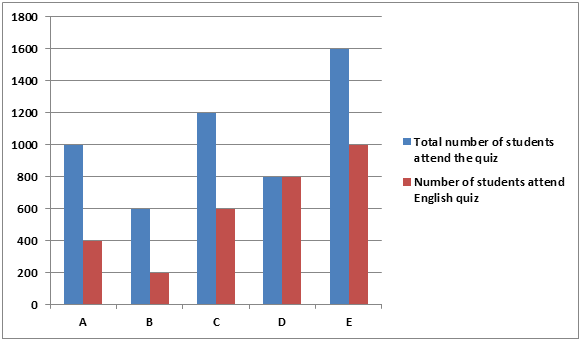
The given bar graph shows the total number students who attended the quiz and the number of students attended the English quiz from five different schools.
Total number of students who attended the quiz = number of students who attended English quiz + number of students who attended Science quiz.
36) What is the average number of students who attended science quiz from A, C and E together?
A.400
B.500
C.600
D.700
E.800
37) The total number of students who attended English quiz from B is what percent of the number of students who attended English quiz from E?
A.20%
B.30%
C.40%
D.50%
E.None of these
38) Find the number of students who attended science quiz from D?
A.100
B.400
C.200
D.300
E.None of these
39) What is the average number of students who attended science quiz from all the schools together?
A.420
B.440
C.450
D.480
E.460
40) What is the ratio of the number of students who attended English quiz from A to D?
A.3:2
B.3:5
C.2:3
D.1:2
E.2:1
Try Data Interpretation Questions Online Mock Test
Answers :
31) Answer: C
Number of cars in E = 100/80 * (320 + 400)
= 900
Number of bikes in E = 100/125 * (280 + 360)
= 512
Required Difference = 900 – 512 = 388
32) Answer: B
Required % = (240 + 360 + 200)/(320 + 400 + 120) * 100
=800/840*100= 95.23%
33) Answer: C
Number of cars, bikes and cycles in E = 120/100 * (160 + 280 + 360)
= 960
Number of cars, bikes and cycles in A = 320 + 240 + 200 = 760
Required Difference = 960 – 760 = 200
34) Answer: A
Required ratio = (240 + 360):(280 + 360)
= 600:640
= 15:16
35) Answer: E
Required Difference = (320 + 160 + 320 + 240) – (200 + 360 + 120 + 200)
= 160
Directions (36-40) :
Number of students attended science quiz from A = 1000 – 400 = 600
Number of students attended science quiz from B = 600 – 200 = 400
Number of students attended science quiz from C = 1200 – 600 = 600
Number of students attended science quiz from D = 800 – 800 = 0
Number of students attended science quiz from E = 1600 – 1000 = 600
36) Answer: C
Required average = (600 + 600 + 600)/3 = 1800/3 =600
37) Answer: A
Required percentage = (200/1000) * 100 = 20%
38) Answer: E
No one attended the science quiz from D. So, 0
39) Answer: B
Required average = (600 + 400 + 600 + 0 + 600)/5
= 2200/5
= 440
40) Answer: D
Required ratio = 400:800
= 1:2
Start Quiz
Directions (41-45): Study the following information carefully and answer the given questions:
The given bar graph shows the number of mobile and watch manufactured in five different companies.
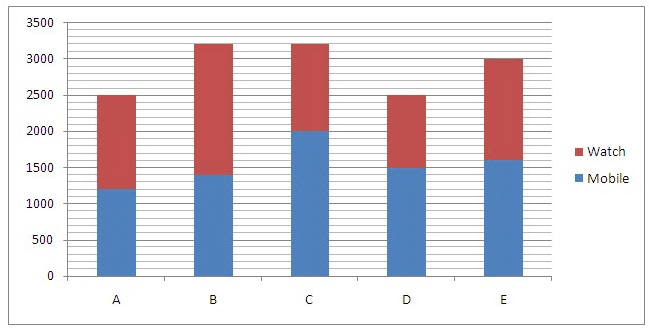
The line graph shows the number of mobile and watch sold in five different companies.
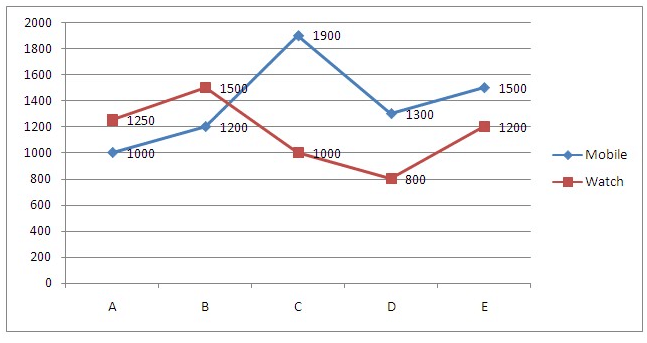
41) What is the difference between the total number of mobiles sold in all the companies together and the total number of watch sold in all the companies together?
A.1120
B.1000
C.1150
D.1250
E.None of these
42) The number of watches manufactured in A and B together is approximately what percent of the number of mobiles manufactured in D and E together?
A.80%
B.85%
C.90%
D.95%
E.None of these
43) What is the ratio of the number of mobiles manufactured in C and B together to the number of watch manufactured in D and E together?
A.11:6
B.13:8
C.15:11
D.17:12
E.None of these
44) The total number of mobiles sold in all the companies together is approximately what percent of the number of mobile manufactured in all the companies together?
A.85%
B.90%
C.95%
D.99%
E.None of these
45) What is the average number of unsold watches in all the companies together?
A.170
B.180
C.190
D.200
E.None of these
Directions (46-50): Study the following information carefully and answer the given questions:
The given bar graph shows the number of students in three different departments in four different colleges.
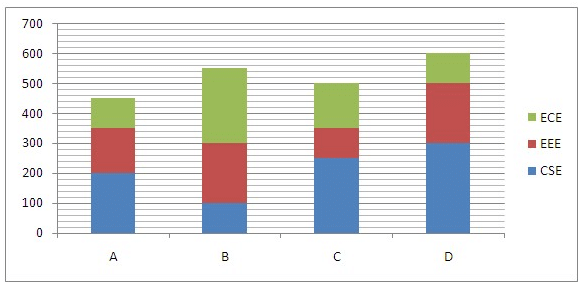
46) What is the ratio of the total number of students in EEE departments in all the colleges together to the total number of students in CSE departments in all the colleges together?
A.13:17
B.11:16
C.3:4
D.5:3
E.1:2
47) What is the difference between the average number of students in college D and A in all the departments together?
A.30
B.50
C.60
D.40
E.20
48) The number of EEE students in C is approximately what percent of the number of ECE students in B?
A.30%
B.25%
C.50%
D.45%
E.40%
49) The total number of students in C in all the departments together is approximately what percent of the total number of students in B in all the departments together?
A.87%
B.89%
C.91%
D.93%
E.95%
50) What is the average number of ECE students in all the colleges together?
A.100
B.200
C.250
D.150
E.75
Try Data Interpretation Questions Online Mock Test
Answers :
41) Answer: C
Total number of sold mobiles=1000 + 1200 + 1900 + 1300 + 1500=6900
Total number of sold watches=1250 + 1500 + 1000 + 800 + 1200=5750
Required Difference=6900 – 5750=1150
42) Answer: E
Required percentage= [(1300 + 1800)/(1500 + 1600)] * 100=100%
43) Answer: D
Required ratio=(2000 + 1400):(1000 + 1400)
=3400:2400
=17:12
44) Answer: B
Total number of sold mobile=1000 + 1200 + 1900 + 1300 + 1500=6900
Total number of manufactured mobile=(1200 + 1400 + 2000 + 1500 + 1600)=7700
Required percentage= (6900/7700) * 100=90%
45) Answer: C
Unsold watch in A=1300 – 1250=50
Unsold watch in B=1800 – 1500=300
Unsold watch in C=1200 – 1000=200
Unsold watch in D=1000 – 800=200
Unsold watch in E=1400 – 1200=200
Required Average=(50 + 300 + 200 + 200 + 200)/5=190
46) Answer: A
CSE students=200 + 100 + 250 + 300=850
EEE students=150 + 200 + 100 + 200=650
Required ratio=650:850
=13:17
47) Answer: B
Difference=(300 + 200 + 100)/3 – (200 + 150 + 100)/3
=50
48) Answer: E
Required percentage=100/250 * 100=40%
49) Answer: C
Required percentage= [(250 + 100 + 150)/(100 + 200 + 250)] * 100
=91%
50) Answer: D
Required average= (100 + 250 + 150 + 100)/4=150
Start Quiz
Directions (51-55): Study the following information carefully and answer the questions given below.
The given bar graph shows the centre government distributes the Wheat and Rice (in kg) to six different states.
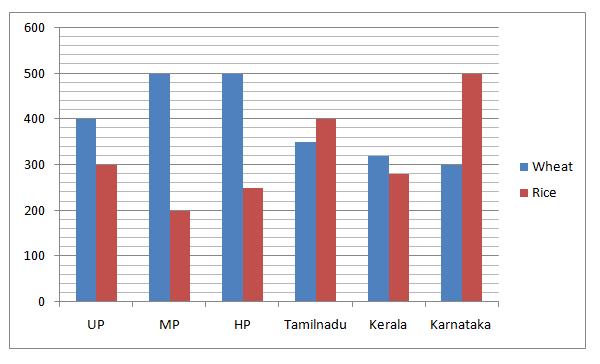
51) Find the total quantity of both wheat and Rice distributed to UP and MP together?
A.1400 kg
B.1600 kg
C.1800 kg
D.1700 kg
E.1500 kg
52) What is the difference between the total quantity of Wheat and Rice distributed to Tamilnadu and the total quantity of wheat and rice distributed to Karnataka?
A.40 kg
B.50 kg
C.30 kg
D.35 kg
E.45 kg
53) What is the total quantity of Rice distributed to all the states together?
A.1935 kg
B.1945 kg
C.1955 kg
D.1930 kg
E.1940 kg
54) Total quantity of Wheat and Rice distributed to Kerala is what percent of the total quantity of Wheat and Rice distributed to HP?
A.65%
B.77%
C.80%
D.70%
E.60%
55) What is the average quantity of Wheat distributed to UP, HP, Kerala and Karnataka together?
A.380 kg
B.390 kg
C.400 kg
D.370 kg
E.None of these
Directions (56-60): Study the following information carefully and answer the questions given below.
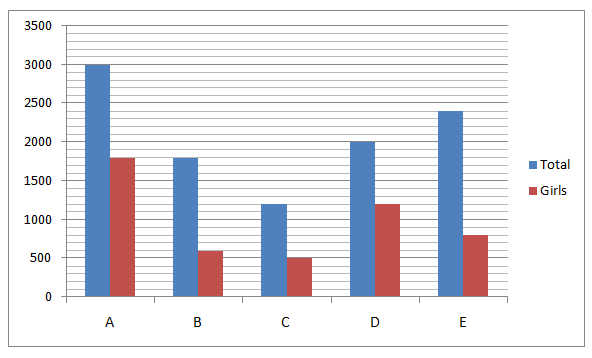
The given bar graph shows the total number of students and the number of girls studying in five different colleges namely A, B, C, D and E in 2018.
56) The number of boys in B is what percent of the total number of students in E?
A.40%
B.50%
C.60%
D.30%
E.None of these
57) What is the average number of boys in A and C?
A.800
B.900
C.850
D.950
E.780
58) In how many colleges, the number of boys is more than that of girls?
A.1
B.3
C.2
D.4
E.None of these
59) What is the average number of boys in all the colleges together?
A.1100
B.1000
C.1200
D.1150
E.None of these
60) What is the ratio of the average number of girls in A, B and D and the average number of students in C and E?
A.2:1
B.3:4
C.4:5
D.2:3
E.None of these
Try Data Interpretation Questions Online Mock Test
Answers :
51) Answer: A
Required total = 400 + 300 + 500 + 200 = 1400
52) Answer: B
Difference = (300 + 500) – (400 + 350) = 50
53) Answer: D
Required total = 300 + 200 + 250 + 400 + 280 + 500 = 1930
54) Answer: C
Required percentage = (320 + 280)/(500 + 250) * 100
= 80%
55) Answer: A
Required average = (400 + 500 + 320 + 300)/4=1520/4
= 380 kg
Directions (56-60) :
56) Answer: B
Required percentage = 1200/2400 * 100 = 50%
57) Answer: D
Required average = (1200 + 700)/2 = 950
58) Answer: B
59) Answer: A
Required average = (1200 + 1200 + 700 + 800 + 1600)/5
= 1100
60) Answer: D
Required ratio = (1800 + 600 + 1200)/3:(1200 + 2400)/2
= 1200:1800
= 2:3
Start Quiz
Directions (61-65): Study the following information carefully and answer the questions given below.
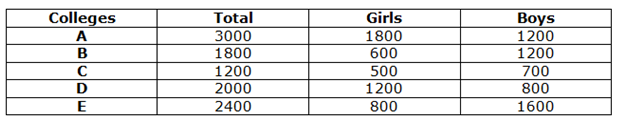
The given bar graph shows the number of employees working in Wipro and Hcl in five different cities namely Chennai, Pune, Mumbai, Kochi and Bangalore.
61) What was the ratio of the number of Wipro employees working in Pune to the number of Hcl employees working in Chennai?
A.2: 3
B.3: 2
C.1: 2
D.2: 1
E.None of these
62) Number of Wipro employees working in Mumbai and Bangalore is approximately what percentage of the all the employees working in Wipro and Hcl in Mumbai and Bangalore?
A.21%
B.32%
C.46%
D.58%
E.65%
63) Number of Hcl employees working in Kochi is what percentage less than the number of Hcl employees working in Bangalore?
A.30%
B.50%
C.70%
D.90%
E.None of these
64) In how many cities, the number of Wipro employees is more than 20% of the total number of Wipro employees?
A.1
B.2
C.3
D.4
E.None of these
65) Which of the following cities have Hcl employees less than 72% of Chennai’s Wipro employees?
A.4
B.3
C.2
D.1
E.0
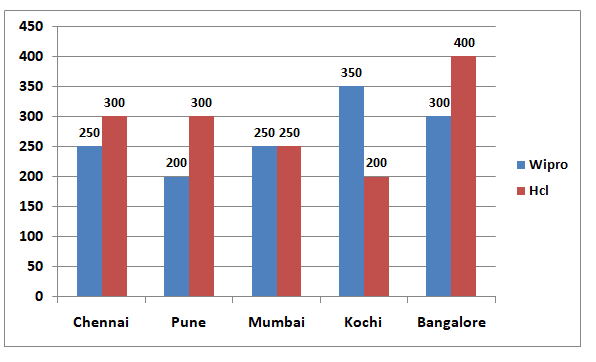
Directions (66-70): Study the following information carefully and answer the given questions.
The given bar graph shows the total sales of JIO and BSNL sim cards (In hundreds) in 6 different months in a certain year.
66) Find the difference between the total sales of JIO sim cards in the month of February, April and June together and the total sales of BSNL sim cards in the month of January, March and May together?
A.3200
B.2400
C.2800
D.3000
E.None of these
67) Find the ratio between the total sales of JIO and BSNL sim cards in the month of January to that of April?
A.15 : 19
B.23 : 27
C.39 : 41
D.11 : 15
E.None of these
68) Find the average sales of BSNL sim cards in all the given months together?
A.1100
B.1300
C.1200
D.1000
E.None of these
69) The total sales of JIO and BSNL sim cards in the month of February is approximately what percentage of total sales of JIO and BSNL sim cards in the month of June?
A.95 %
B.74 %
C.82 %
D.116 %
E.63 %
70) In which of the following months, the total sales of both the sim cards have third highest sales?
A.January
B.April
C.May
D.February
E.None of these
Try Data Interpretation Questions Online Mock Test
Answers :
61) Answer: A
Number of Wipro employees working in Pune = 200
Number of Hcl employees working in Chennai = 300
Required ratio = 200: 300 = 2: 3
62) Answer: C
Number of Wipro employees in Mumbai and Bangalore = 250 + 300 = 550
Number of all the employees in Mumbai and Bangalore = 250 + 250 + 300 + 400 = 1200
Required % = 550/1200 * 100
= 46%
63) Answer: B
Number of Hcl employees in Kochi = 200
Number of Hcl employees in Bangalore = 400
Required % = (400 – 200)/400 * 100 = 50%
64) Answer: B
Number of Wipro employees = 250 + 200 + 250 + 350 + 300 = 1350
20% of 1350 = 270
Wipro employees in Kochi and Bangalore are more than 270.
65) Answer: E
72% of Chennai’s Wipro employees = 72% * 250 = 180
No cities have Hcl employees less than 180.
66) Answer: B
The total sales of JIO sim cards in the month of February, April and June together
= > 1800 + 1600 + 2000 = 5400
The total sales of BSNL sim cards in the month of January, March and May together
= > 800 + 1200 + 1000 = 3000
Required difference = 5400 – 3000 = 2400
67) Answer: D
The total sales of JIO and BSNL sim cards in the month of January
= > 1400 + 800 = 2200
The total sales of JIO and BSNL sim cards in the month of April
= > 1600 + 1400 = 3000
Required ratio = 2200 : 3000 = 11 : 15
68) Answer: A
The average sales of BSNL sim cards in all the given months together
= > (800 + 900 + 1200 + 1400 + 1000 + 1300) / 6
= > 6600 / 6 = 1100
69) Answer: C
The total sales of JIO and BSNL sim cards in the month of February
= > 1800 + 900 = 2700
The total sales of JIO and BSNL sim cards in the month of June
= > 2000 + 1300 = 3300
Required % = (2700 / 3300) * 100 = 81.81 % = 82 %
70) Answer: D
In January = > 1400 + 800 = 2200
In February = > 1800 + 900 = 2700
In March = > 2100 + 1200 = 3300
In April = > 1600 + 1400 = 3000
In May = > 1500 + 1000 = 2500
In June = > 2000 + 1300 = 3300
The third highest sales in February while comparing with all the given months.
Start Quiz
Directions (71-75): Study the following information carefully and answer the questions given below.
The given bar graph shows the number of bird sanctuary in six different states.
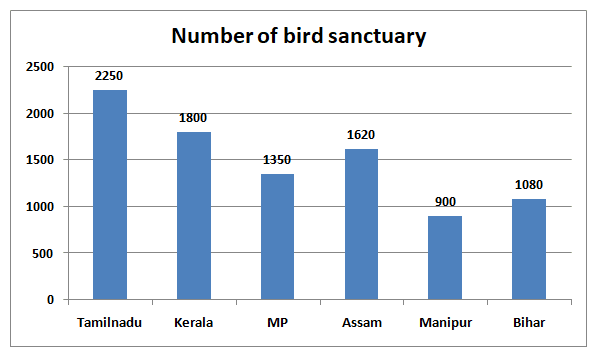
71) What is difference between the number of bird sanctuary in Manipur and MP?
A.550
B.350
C.450
D.500
E.650
72) The number of bird sanctuary in Bihar is what percent of the number of bird sanctuary in Kerala?
A.60%
B.55%
C.65%
D.75%
E.70%
73) The number of bird sanctuary in UP is 40% more than the number of bird sanctuary in Assam. Find the number of bird sanctuary in UP?
A.2248
B.2258
C.2268
D.2278
E.None of these
74) What is the average number of bird sanctuary in Assam, Bihar and MP?
A.1450
B.1550
C.1750
D.1650
E.1350
75) The number of bird sanctuary in Manipur is what percent of the number of bird sanctuary in Tamilnadu?
A.30%
B.40%
C.50%
D.60%
E.None of these
Directions (76-80): Study the following information carefully and answer the questions given below.
The given bar graph shows the number of sarees sold in two different online stores in six different days in a week.
76) What is the average number of sarees sold from Amazon in all the days together?
A.560
B.545
C.555
D.572
E.575
77) What is the ratio of the number of sarees sold in Monday and Saturday together from Amazon to Flipkart?
A.40:37
B.41:38
C.43:39
D.30:29
E.None of these
78) The number of sarees sold in Wednesday from Flipkart and Amazon together is approximately what percent of the number of sarees sold in Thursday from Flipkart and Amazon together?
A.105%
B.102%
C.108%
D.110%
E.115%
79) If the average number of sarees sold from Flipkart from Tuesday, Friday and Sunday together is 390, then find the number of sarees sold from Flipkart in Sunday?
A.340
B.350
C.360
D.370
E.380
80) If the number of sarees sold from Amazon, Snapdeal and E-bay on Friday is 5:6:9, then what is the difference between the number of sarees sold from Snapdeal and E-bay on Friday?
A.180
B.270
C.300
D.240
E.360
Try Data Interpretation Questions Online Mock Test
Answers :
71) Answer: C
Required difference = 1350 – 900 = 450
72) Answer: A
Required percentage = 1080/1800 * 100 = 60%
= 60%
73) Answer: C
Number of bird sanctuary in UP = 140/100 * 1620
= 2268
74) Answer: E
Required average = (1620 + 1080 + 1350)/3
= 4050/3 = 1350
75) Answer: B
Required percentage = 900/2250 * 100
= 40%
76) Answer: C
Required average = (480 + 550 + 560 + 520 + 500 + 720)/6
= 3330/6
= 555
77) Answer: A
Required ratio = (480 + 720):(550 + 560)
= 1200:1110
= 40:37
78) Answer: B
Required percentage = (560 + 480)/(520 + 500) * 100
= (1040/1020) * 100
= 102%
79) Answer: D
Number of sarees sold from Flipkart in Sunday = 390 * 3 – 450 – 350
= 370
80) Answer: C
Required difference = 3/5 * 500 = 300
Download Bar Graph Questions for IBPS Clerk Prelims Exam PDF
For More Bar Graph Questions PDF
Try IBPS Clerk Free Online Mock Test
Try SBI Clerk Free Online Mock Test


