Data Interpretation Test Practice – Day 60 | Data Interpretation Questions:
Dear Readers, Important Practice Data Interpretation Questions for IBPS Exams 2017 was given here with Solutions. Aspirants those who are preparing for the Bank Examination and other Competitive Examination can use this material.
Click Here for More Practice Data Interpretation Questions
[WpProQuiz 782]
Directions (Q1-5) Study the following information carefully and answer the questions given below
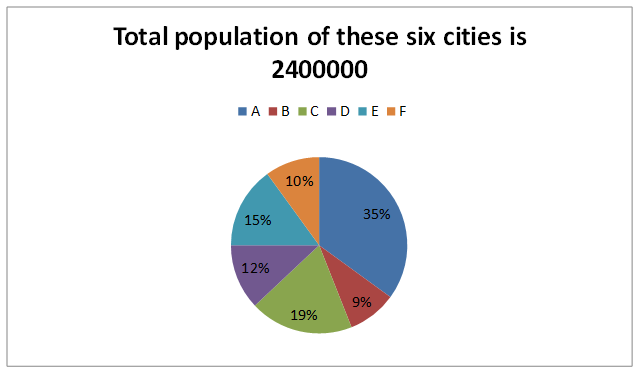
The following pie chart shows percentage distribution of population in six different cities and the table shows the percentage distribution of people of different age group in those cities.


| City | Percentage of voters out of total population | Persons of age group 09<Age<18 Out of total population | Persons of age group 18<Age<30 Out of total population | Persons of age group 30<Age<55 Out of total population |
| A | 61% | 39% | 35% | 20% |
| B | 78% | 15% | 22% | 14% |
| C | —% | 16% | 31% | 40% |
| D | 14% | 12% | 26% | 32% |
| E | 80% | —% | 42% | 22% |
| F | 64% | 10% | 24% | 15% |
1.In city A no person is of age less than 9 years then find how many voters are of age more than 55 years?
a) 40500
b) 38600
c) 50400
d) 194500
e) None of these
2. In city B how many percentage of persons are of age less than 9 years?
a) 7%
b) 10%
c) 16%
d) 4%
e) cannot be determined
3. In city C 4,560 persons are below 9 years of age. Find total no of voters.
a) 86%
b) 65%
c) 71%
d) 83%
e) 99%
4. In city E if no of persons below 9 years of age are 2000 then what is the percentage of people between the age group of 9-18 years.
a) 19.44%
b) 15%
c) 16.8%
d) 17.9%
e) Cant be determined
5. Find the no of persons below 9 years of age in city F.
a) 40600
b) 62400
c) 34700
d) 56780
e) None of these
Directions (6-10): study the following information carefully and answer the questions given below
Following diagram shows the result of survey conducted on people about their interest in different sports.
6)How many people are there who like exactly three types of sports out of given four?
a) 98
b) 104
c) 108
d) 112
e) 115
7)The number of people who like exactly two types of sports is what percentage of total number of people surveyed?
a) 40%
b) 32%
c) 30%
d) 26%
e) 24%
8)What is the difference between the number of people who like either only Cricket or only Soccer and the no of people who like either only Hockey or only tennis?
a)1
b) 3
c) 5
d) 7
e) 9
9)What is the ratio of no of people who like cricket to the no of people who like only tennis?
a) 40:13
b) 59:16
c) 63:23
d) 64:25
e) 70:29
10)The no of people who like exactly one type of sports is what percent of the total no of people surveyed?
a) 42.5%
b) 45.4%
c) 47.8%
d) 51.1%
e) 54%