Data Interpretation Test Practice – Day 64 | Data Interpretation Questions:
Dear Readers, Important Practice Data Interpretation Questions for IBPS Exams 2017 was given here with Solutions. Aspirants those who are preparing for the Bank Examination and other Competitive Examination can use this material.
Click Here for More Practice Data Interpretation Questions
[WpProQuiz 821]
Click “Start Quiz” to attend these Questions and view Solutions
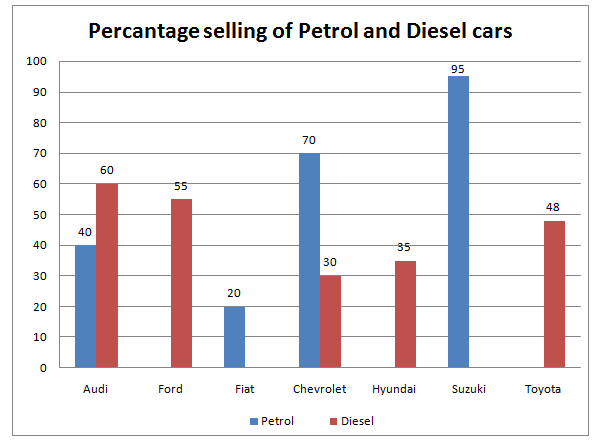
Directions (Q. 1-5): Study the following diagrams of Pie-chart and bar graph carefully and answer the questions given below


- What is the difference between the sale of petrol cars in Hyundai and Fiat?
a) 5000
b) 5300
c) 6100
d) 5500
e) 5700
- Which company sells maximum number of petrol cars?
a) Fiat
b) Suzuki
c) Hyundai
d) Toyota
e) Audi
- How many diesel cars sell in Suzuki?
a) 600
b) 550
c) 500
d) 650
e) 450
- What is the difference between the sale of petrol cars in Audi and that of sale of diesel cars in Chevrolet?
a) 3500
b) 2500
c) 4250
d) 3000
e) 5000
- What is the percentage of the total number of diesel cars sales?
a) 70
b) 39
c) 63
d) 58
e) 53
Directions (Q. 6-10): Study the following graph and answer the questions given below:
Number of students (in thousands) studying in three different universities during the given five years

- What is the respective ratio between the number of students who studied in Cambridge University in the years 2013 and 2015 together and the number of students who studied in Oxford University in the year 2012 and 2016 together?
a) 11 : 5
b) 13 : 7
c) 5 : 11
d) 7 : 13
e) None of these
- If the total number of students in the year 2014 was 455030, the total number of students who studied in given three universities was approximately what percent of the total students?
a) 11
b) 9
c) 7
d) 15
e) 14
- What is the total number of students who studied in Oxford University and who studied in Harvard University in the years 2013, 2014 and 2016 together?
a) 99000
b) 90000
c) 95000
d) 96000
e) 91000
- The total number of students who studied in Harvard University in the years 2012 and 2015 together are approximately what percent of the total number of students who studied in all three universities in the same years?
a) 40
b) 25
c) 37
d) 32
e) 39
- Out of the total number of students who studied in the given three universities in the year 2016, 38% were girls. How many boys studied in Harvard University in the same year?
a) 2950
b) 3150
c) 2750
d) 3000
e) 3100
Click Here for More Practice Data Interpretation Questions


